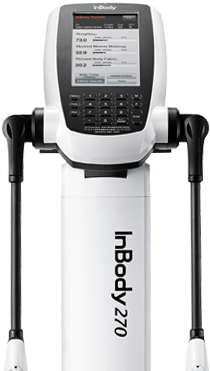
NOW AVAILABLE IN OUR NEATH STORE

GO BEYOND
THE SCALE

  15 second tests

Quickly measure fat mass, muscle mass, and body water. Auto-calibrated, user-friendly, and non-invasive, testing is fast and easy—just stand on the device and hold the hand electrodes.

  Accurate results

Direct Segmental Multi-Frequency BIA technology measures body segments separately for an accurate analysis based on your unique body.

  Detailed Data

Get essential outputs for evaluating overall health and wellness. Identify changes in body composition, track progress, validate programs, and deliver actionable advice based on trustworthy data.

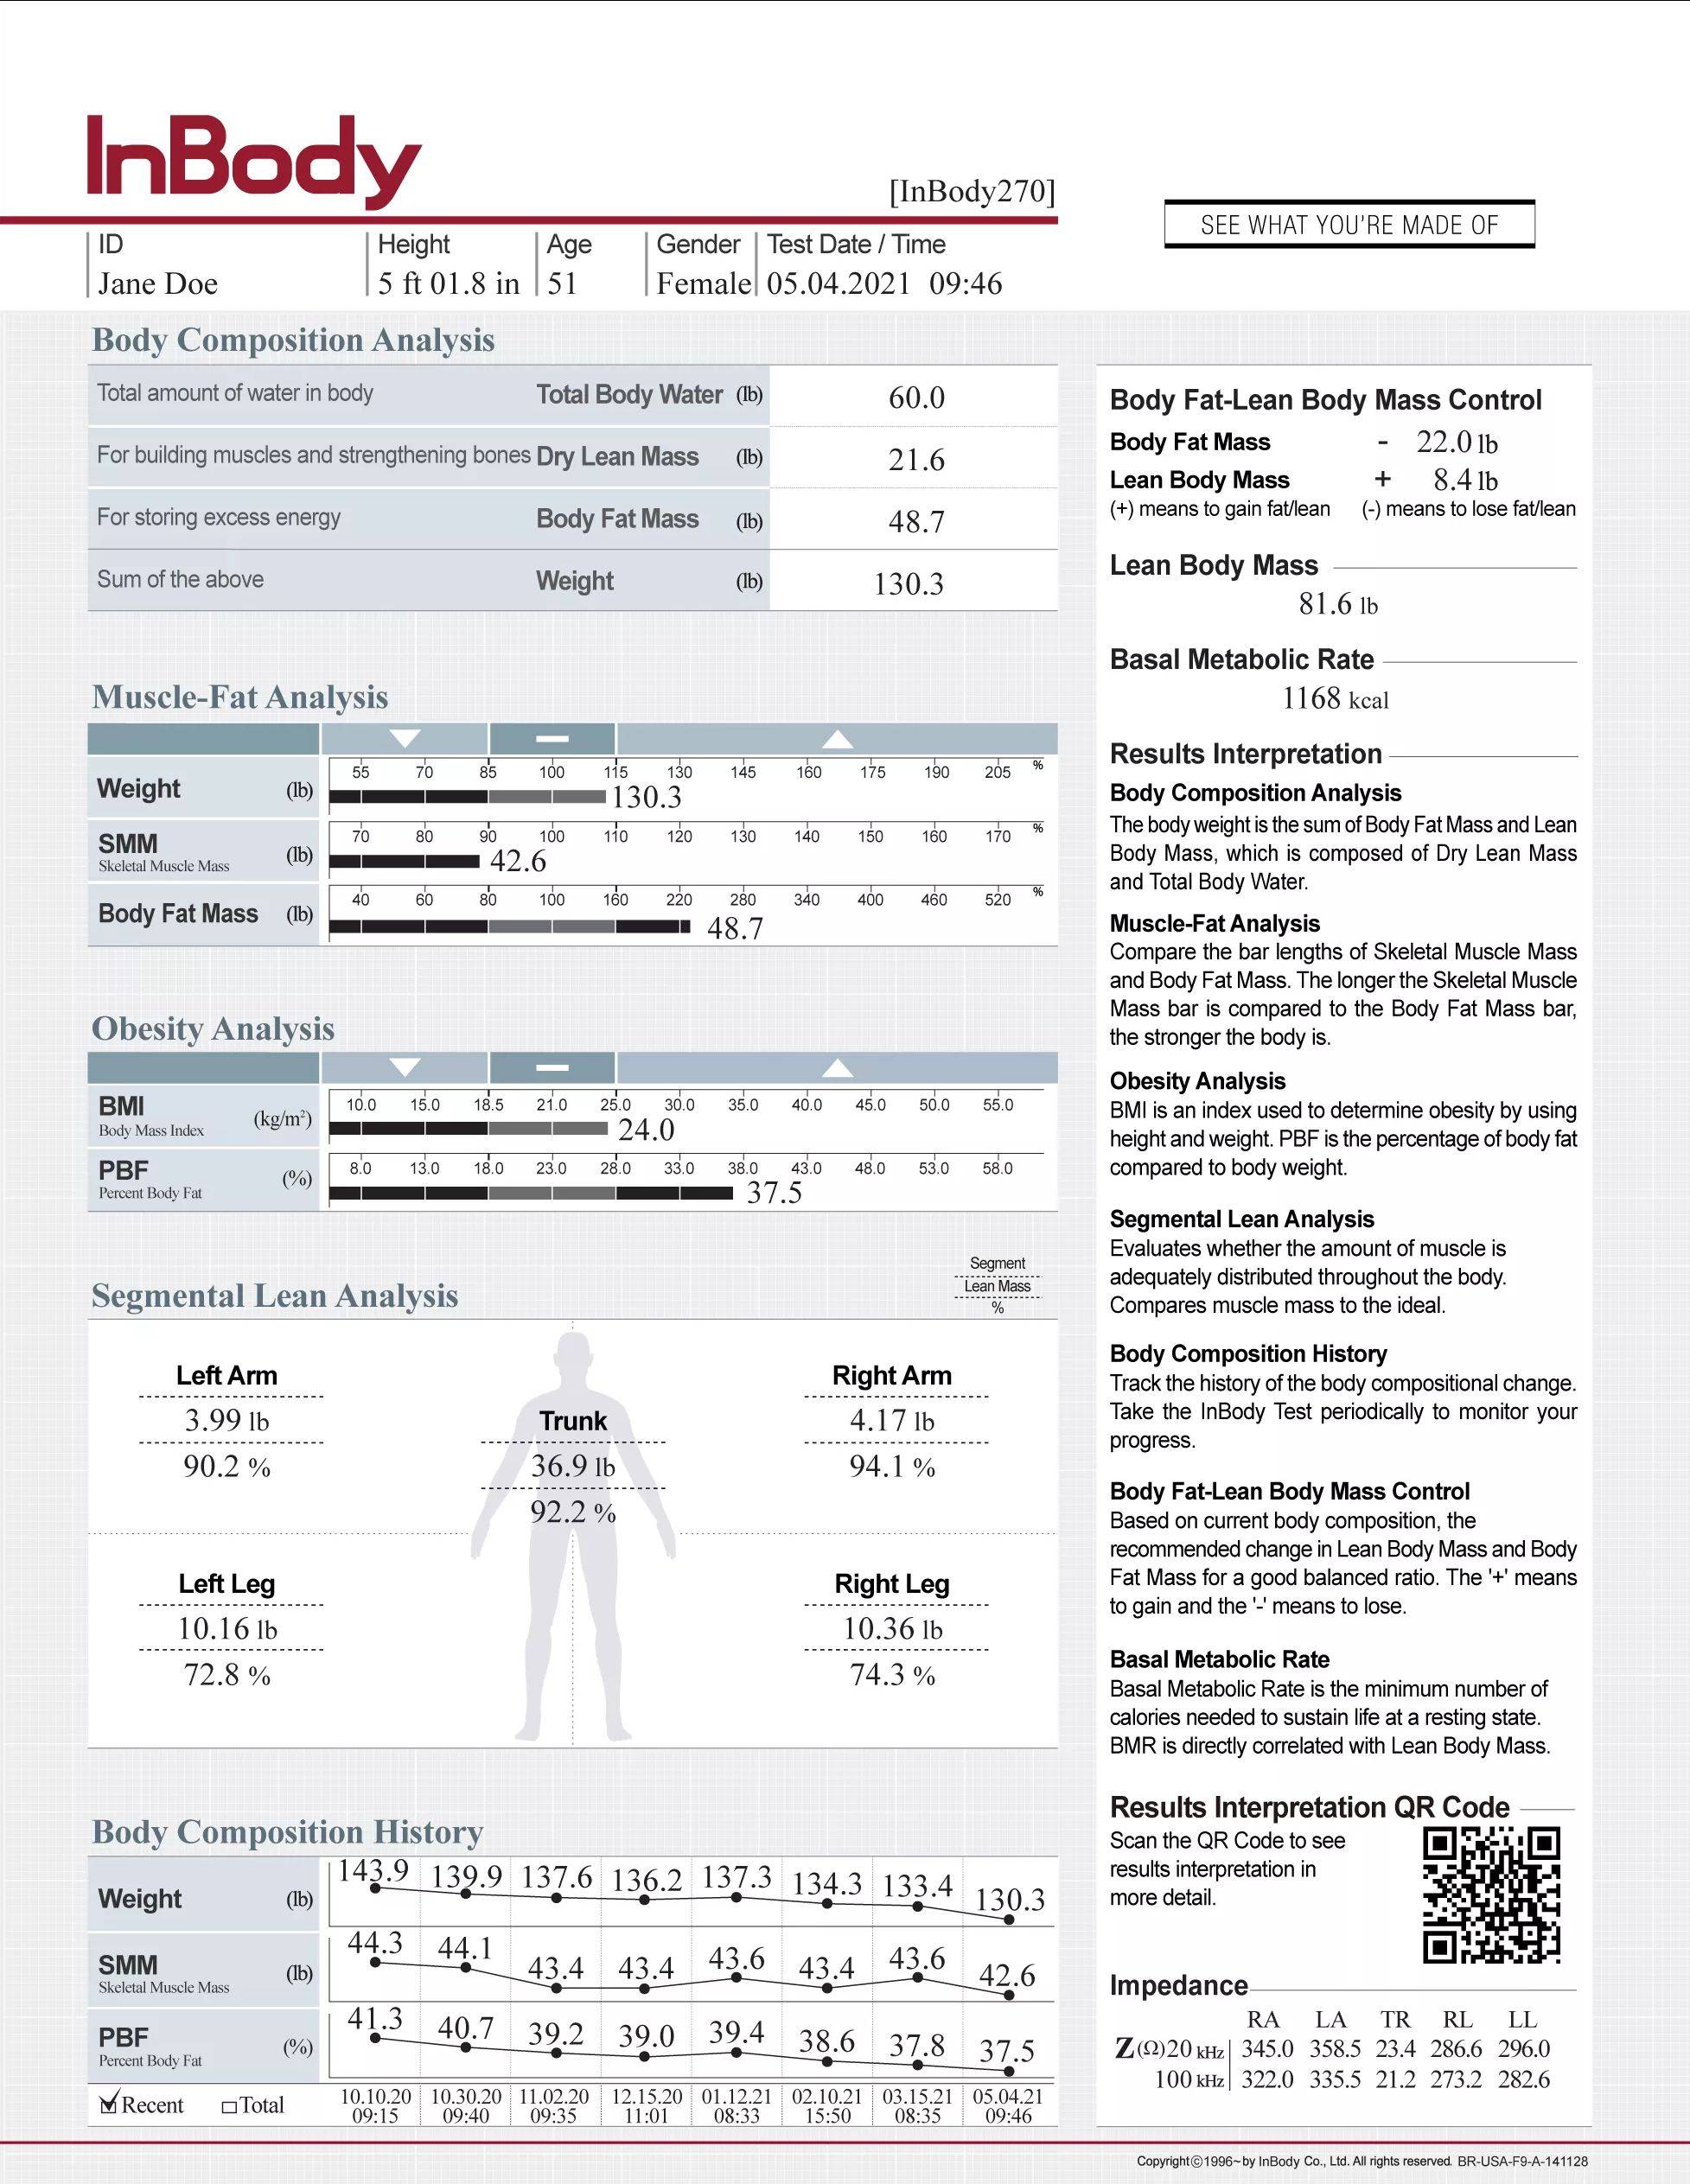
Use your Result Sheet to reveal key insights

Muscle-Fat Analysis

Make the connection between Weight, Skeletal Muscle Mass, and Body Fat Mass and start developing a personalized plan.

Segmental Lean Analysis

Get an in-depth analysis of your lean body mass. Evaluate if you have a sufficient level of lean body mass in each segment of the body (arms, legs, and trunk) and spot any imbalances between the limbs.


Basal Metabolic Rate

Understand how many calories you naturally burn at rest to develop a unique nutrition plan based on your activity level and personal health goals.

Body Composition History

Track changes in Weight, Skeletal Muscle Mass, and Percent Body Fat over time. Spot trends and make timely adjustments to keep yourself heading in the right direction.

Learn more about the Result Sheet

Body Composition Analysis & Body Water

Body Composition Analysis sits at the top of the InBody 270 Result Sheet because it provides an excellent overview of your body composition.

This section breaks down your Weight as a sum of Total Body Water, Dry Lean Mass, and Body Fat Mass. At the top, Total Body Water shows how much water comprises your weight. Right below is your Dry Lean Mass. This value is the weight of the protein and mineral content in your body.

WHY THIS MATTERS

Because protein makes up most of your muscle, and Dry Lean Mass excludes body water, if your Dry Lean Mass increases, then this is generally a sign that you have gained muscle mass!

Below Dry Lean Mass is Body Fat Mass. This value reveals how much body fat, both surface level (subcutaneous) and internal (visceral), makes up your weight.

Lean Body Mass (LBM) is the sum of your Total Body Water and Dry Lean Mass. LBM is the weight of everything in your body except fat; for this reason, it is also called Fat-Free Mass. Lean Body Mass includes muscle, water, bones, and organs.

Muscle-Fat Analysis

This section shows how your Weight, Skeletal Muscle Mass, and Body Fat Mass compare to the healthy average range of people of the same height and sex. With Muscle-Fat Analysis, you get a better understanding of where your current body composition is so you can make any changes to get it to where you would like it to be.

Muscle-Fat Analysis is a favorite output for many people because it provides an easy-to-understand overview of body composition and helps narrow the focus of health goals.

Muscle-Fat Analysis has three components:

WEIGHT

This is your Total Body Weight.

SKELETAL MUSCLE MASS (SMM)

This is the total weight of your Skeletal Muscle Mass (SMM). SMM is the muscle that can be grown and developed through exercise. Unlike Lean Body Mass, which includes everything except body fat, you can confidently interpret an increase in SMM as muscle gain.


BODY FAT MASS

This is how much body fat you have (both the surface level and internal fat).

The Muscle-Fat Analysis also tells you whether you have a healthy balance of SMM and Body Fat Mass in respect to your weight.

Body Composition History

This graph displays some of the most vital measurements from your previous tests (up to 8). With Body Composition History, you can easily spot trends and track your progress over time.

At the bottom of the Result Sheet is the Body Composition History graph, which automatically tracks your Weight, Skeletal Muscle Mass, and Percent Body Fat measures from recent tests.

The purpose of this graph is to let you monitor positive and negative changes in body composition so you can adjust your diet and exercise plan to get the results you desire.

The Body Composition History graph makes it easy to spot when positive body composition changes occur. For instance, a gradual increase in Skeletal Muscle Mass and decrease in Body Fat Mass over the past few tests indicates that you’ve made excellent progress towards improving your overall body composition.

The Body Composition History graph also makes it easier to spot negative body composition changes. For example, a drop in body weight may initially appear like a positive change, but regular testing may show that this trend was due to muscle loss, not fat loss.

Segmental Lean Analysis

When used correctly, this is one of the most valuable sections of your InBody Result Sheet.

Segmental Lean Analysis displays your Lean Body Mass (Fat-Free Mass) in all body segments in pounds and its sufficiency to support your body weight as a percentage.

Interpreting your Segmental Lean Analysis can help you:

- Spot areas for improvement

- Assess if your Lean Body Mass is sufficiently developed in all body segments

- Identify if you have any muscle imbalances

The InBody divides your body into five body segments: your arms, legs, and trunk (torso), or the area between your neck, arms, and legs. The data for each body segment is displayed as two bars.

TOP SECTION

The top value shows how much Lean Body Mass (Fat-Free Mass) you have in pounds for each body segment.

BOTTOM SECTION

The bottom value compares your Lean Body Mass against your measured body weight, which helps you determine if you have enough Lean Body Mass to support your body weight, where 100% is sufficient.

Try our body analyser today at Keto-Pro, 22 Queen Street, Neath, SA11 1DL

Free Shipping over £50
Easy no quibble Returns
Premium quality guarantee
Secure Shopping
Cart cart 0
You have successfully subscribed!